Teardown: Uber’s Data Quality & The Statistical Outlier Guardrail
The fastest way to lose trust in a dashboard isn’t a system outage; it’s a single, nonsensical data point that destroys your averages.
We have all seen it: a sales report showing a 5,000% spike because a rep entered a test deal value of $1,000,000 instead of $100. For a Data Analyst, the immediate aftermath is predictable. The CFO calls, asking why projections are off, and you spend the next three hours performing “janitorial work”—tracing the bad row, hardcoding an exclusion in SQL (WHERE id <> 12345), and refreshing the cache.
While working with scaling operations teams, I’ve observed that most attempt to solve this with static validation rules (e.g., “Deals cannot exceed $50k”). The problem? As the business grows, legitimate deals eventually do exceed $50k, and the automation breaks valid data.
There is a more resilient approach, inspired by Uber’s Data Quality Monitor, which uses statistical distribution rather than rigid thresholds to flag anomalies.
Here is how you can implement the Statistical Outlier Guardrail using standard automation tools to protect your reporting pipelines.
The Challenge: Static Thresholds Decay
The context for this case study involves a high-volume operational environment—imagine a logistics dashboard or a B2C transaction log. The team relied on manual “spot checks” and static filters to keep data clean.
The “Whac-A-Mole” Cycle
- Ingestion: Data flows from the source (CRM/App) to the Warehouse.
- Pollution: An outlier enters (typo, test data, or currency conversion error).
- Discovery: The analyst finds the error after the executive report has been generated.
- Patching: A hardcoded SQL filter is added to ignore that specific record.
This is not governance; it is damage control. The goal of the Statistical Outlier Guardrail is to move from detecting errors to intercepting them based on statistical probability.
The Solution: Dynamic Z-Score Filtering
Instead of asking “Is this number too high?” (which is subjective), we ask “How far is this number from the norm?” (which is mathematical).
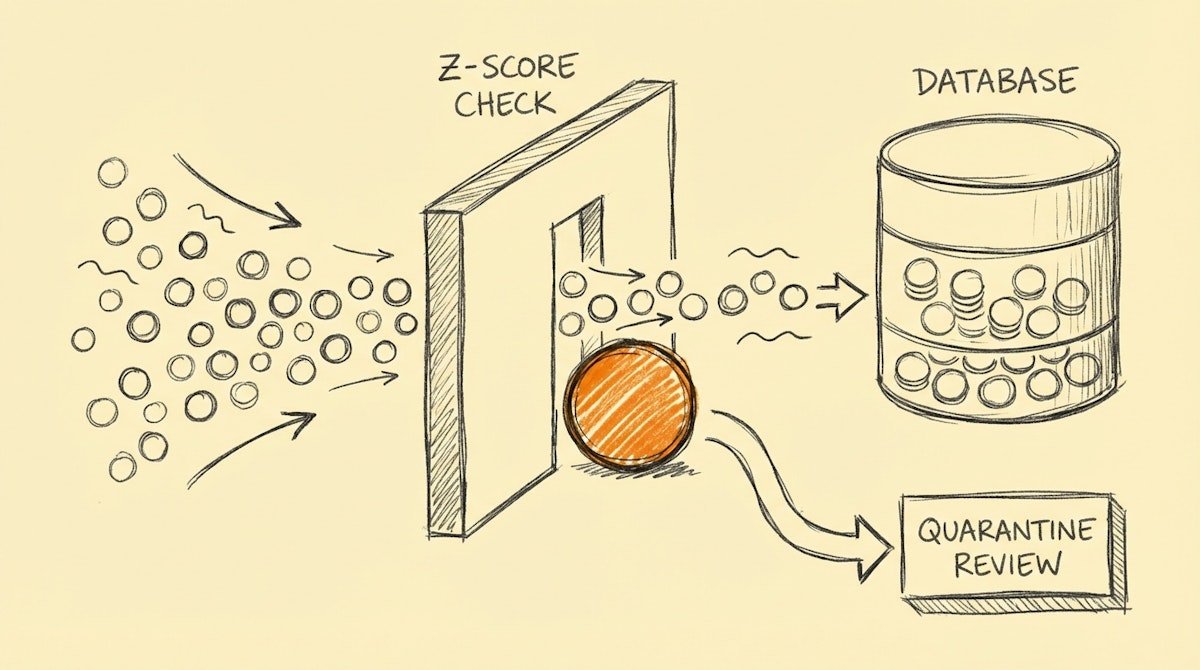
This involves calculating a Z-Score (Standard Score) for incoming data points relative to a rolling window of historical data. If a data point deviates by more than 3 standard deviations (Sigma > 3) from the mean, it is automatically quarantined before it hits the production database.
The Architecture
I have observed this pattern implemented successfully using n8n or Make combined with a lightweight database (PostgreSQL or even a cached list in Redis).
- Buffered Ingestion: Data is not written immediately. It is held in a temporary state.
- Context Retrieval: The automation fetches the Mean and Standard Deviation of the last 1,000 records for that specific metric.
- Score Calculation: The workflow calculates the Z-Score:
(Value - Mean) / Standard Deviation. - Routing Logic:
- Z-Score < 3: Pass to Data Warehouse.
- Z-Score > 3: Route to “quarantine” Slack channel for analyst approval.
| Feature | Static Thresholds | Statistical Guardrail |
|---|---|---|
| Definition | "Value > 10,000" | "Value > 3 Sigma" |
| Maintenance | Manual updates | Self-adjusting |
| Risk | Blocks legitimate growth | Catches anomalies only |
| Action | Silent Failure / Error | Human-in-the-Loop Review |
Implementation Details
You do not need a data science degree to build this. Most automation platforms offer Math nodes, or you can use a simple Python/JavaScript snippet step.
The Formula Logic:
// Simple JavaScript Step for n8n/Zapier
const value = inputData.amount;
const mean = inputData.rolling_average;
const stdDev = inputData.std_deviation;

const zScore = (value - mean) / stdDev;

if (Math.abs(zScore) > 3) {
  return { status: "quarantine", risk: "high" };
} else {
  return { status: "approved", risk: "low" };
}
When a record is flagged, it shouldn't just be deleted. It is sent to a dedicated Slack channel with a button: “Approve Exception” or “Reject & Discard”.
If the Analyst approves the exception (e.g., “Yes, we actually did close a $1M deal!”), the automation inserts the record. Crucially, this new high value naturally shifts the moving average and standard deviation up, meaning the next $1M deal won't be flagged. The system learns what “normal” looks like without manual reconfiguration.
Results: Trust and Time Savings
In scenarios where this pattern is applied, the results are usually binary: either the data is trustworthy, or it isn't.
- Trust: Stakeholders stop questioning the integrity of the dashboard. They know that if a number is there, it passed the statistical gate.
- Efficiency: The “Data Janitorial” time—scrubbing outliers and fixing broken averages—drops significantly. I estimate this saves 5-10 hours a month for a data team, but the real value is avoiding the reputation hit of presenting bad data.
Conclusion
Governance isn't about creating stricter walls; it's about creating smarter gates. By borrowing the Statistical Outlier Guardrail concept from engineering giants like Uber, we can build low-code data pipelines that are resilient to human error and scalable by design.
For the Data Analyst, this means moving from a role of retroactive cleaner to proactive architect of data integrity.