Guaranteing Dashboard Trust With The Data Heartbeat Process
We have all received that message. It usually comes on a Monday morning, just before a weekly review: "The numbers on the dashboard don't look right. Are these up to date?"
For a Data Analyst, this is a nightmare scenario. You log in, check your ETL workflows, and see green checkmarks everywhere. The automation ran successfully. The APIs responded with a 200 OK. Yet, the dashboard is showing data from three days ago.
The issue wasn’t a crash; it was a silent failure. Maybe the source API returned an empty list because of a permission change, or a filter upstream was accidentally tightened. The pipeline "worked," but the data didn't flow.
When this happens, the cost isn't just technical—it's relational. Stakeholders lose trust in the reporting, and once that trust is broken, they go back to manual spreadsheets.
I have observed this pattern in numerous scaling organizations. The solution isn't just better error handling on the ingestion pipeline; it requires a fundamental shift in how we monitor data health. We need to move from monitoring process execution to monitoring data freshness.
This is where the Data Heartbeat Process comes in.
The Concept: Data Observability vs. Pipeline Monitoring
In the software engineering world, "observability" is a standard practice. In the data world, it is still catching up. Barr Moses, CEO of Monte Carlo Data, popularized the term "Data Observability" to describe this gap. The core idea is simple: just because the pipes are not leaking doesn't mean the water is clean (or flowing at all).
Most low-code automations (using Make, n8n, or Python scripts) rely on Pipeline Monitoring. They alert you if a module errors out. The Data Heartbeat Process relies on Freshness Monitoring. It asks a different question: "When was the last time a valid record landed in the destination?"
The Difference at a Glance
| Feature | Pipeline Status Monitoring | Data Heartbeat Monitoring |
|---|---|---|
| What it tracks | Script Execution (Success/Fail) | Data Timestamp (Recency) |
| Silent Failures | Missed (e.g. empty API response) | Detected (Timestamp > Threshold) |
| Alert Context | "Scenario Failed" | "Data is 4 hours stale" |
The Case Study: Solving the "Zero-Row" Panic
I can think of a specific scenario involving a mid-sized e-commerce operation that perfectly illustrates this challenge. They relied on a complex set of automations to pull orders from Shopify, transform them via a standardized schema, and load them into a PostgreSQL database for visualization in Tableau.
The Problem
One day, the API token for a secondary marketing channel expired. The automation ran, authenticated (partially), and requested the last 24 hours of data. The API didn't return a 401 Unauthorized error immediately; instead, it returned a 200 OK with an empty JSON array [].
The automation platform marked the run as "Success." It successfully processed zero records.
Two days later, the VP of Marketing noticed the attribution numbers for that channel had flatlined. By then, 48 hours of data were missing, and the team had to scramble to backfill the gap manually.
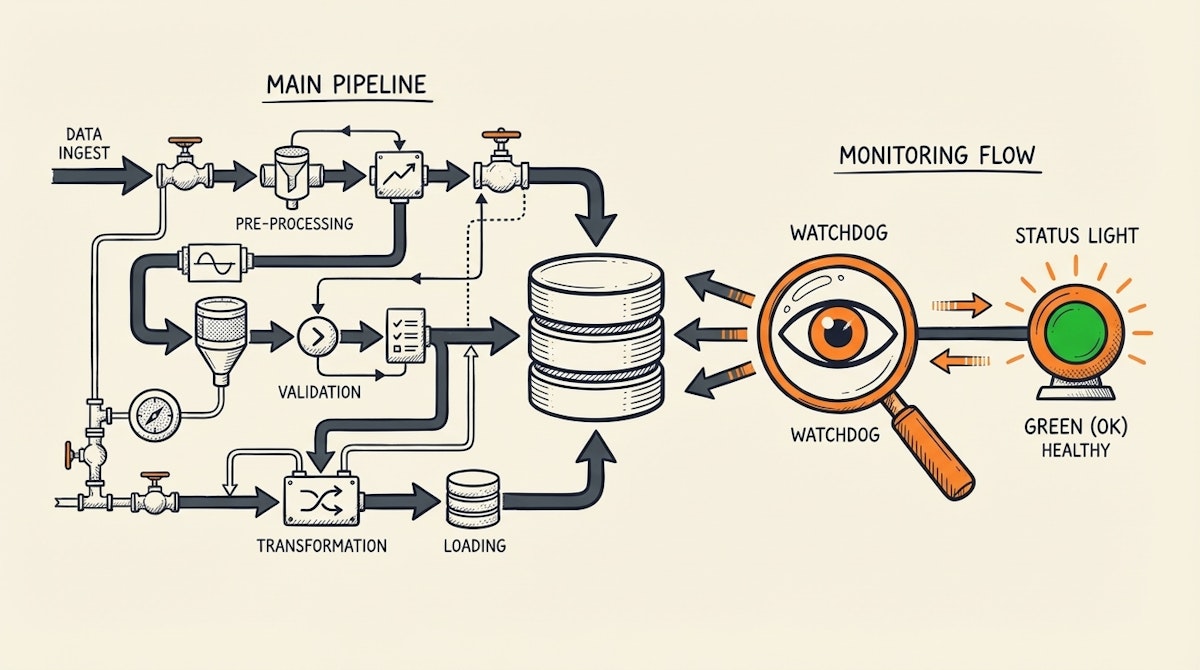
The Solution: Implementing the Data Heartbeat Process
To prevent this, the team implemented a "Watchdog" or "Heartbeat" automation. This is a separate, lightweight process that runs independently of the main ETL pipeline.
Here is how the process is structured:
1. Decouple Monitoring from Ingestion
Do not put the check inside the main data pipeline. If the pipeline hangs or fails to start, the check won't run. The Heartbeat must be an external observer.
2. The "MAX(created_at)" Query
The Heartbeat automation runs every hour. It connects directly to the destination (the Data Warehouse or Reporting Base) and runs a simple query:
SELECT MAX(created_at) as last_update FROM core_orders_table
3. The Threshold Logic
The automation compares last_update with NOW().
- If the difference is less than 2 hours: Healthy.
- If the difference is greater than 2 hours: Alert.
This logic captures all failure modes: pipeline crashes, API outages, silent zero-row returns, or even network latency.
4. The Visibility Layer
Instead of just pinging Slack, the team updated a simple "Data Status" record in a visible dashboard. The BI report itself included a header: "Data freshness: [Live] - Last update: 15 mins ago."
Results and Impact
Implementing this approach changed the dynamic between the data team and the stakeholders:
- Detection Time: The team went from detecting issues in 48 hours (via user complaints) to 1 hour (via automated alerts).
- Trust Metric: Stakeholders stopped asking "Is this up to date?" because the report itself self-certified its freshness.
- Maintenance Overhead: It reduced the need for manual "spot checks" every morning, saving the analyst roughly 2-3 hours per week of anxiety-driven monitoring.
Conclusion
Automation is powerful, but it is not infallible. As Data Analysts, our job is not just to build the pipes but to ensure the water flowing through them is drinkable.
The Data Heartbeat Process is a humble but critical addition to any data stack. It acknowledges that things will break, and it prioritizes letting you know before your boss does. By shifting focus from "Did the script finish?" to "Is the data fresh?", we build systems that are resilient enough to support high-stakes decision-making.
References:
Related posts: