Assembling The Ops Reliability Toolkit: Mimicking PagerDuty’s Incident Response
Introduction
There is a specific type of anxiety that only Internal Ops Managers know. It is the silence that occurs when a high-volume workflow fails, but nobody screams—yet.
I have observed that in many scaling organizations, the automation landscape resembles a black box. You have dozens of scenarios running in Make, n8n, or Zapier handling critical tasks like employee onboarding or vendor payments. When they work, you are a hero. When they fail silently—perhaps due to a changed API key or a validation error that wasn't caught—you lose the trust you fought hard to build.
The difference between a fragile setup and a resilient system isn't just about better logic; it is about visibility. Software engineering teams solved this decades ago with the concept of "Observability" and tools like PagerDuty. They do not just hope code runs; they build a stack specifically to tell them when it doesn't.
For internal operations, we rarely need enterprise-grade engineering tools, but we do need their philosophy. This toolkit focuses on assembling a "Low-Code Observability Stack" to transform error handling from a panic-induced scramble into a structured incident response process.
The Core Problem: The "Silent Failure" Loop
Most no-code platforms have built-in error notifications, but they are often insufficient for an Ops Manager responsible for the whole company.
- Email fatigue: Platform alerts get buried in your inbox.
- Lack of context: A "400 Error" email doesn't tell you which employee's onboarding failed.
- Zero stakeholder visibility: HR or Finance teams are left wondering why the data hasn't arrived, leading to manual check-ins.
To solve this, I suggest assembling a toolkit that separates the logic of the automation from the governance of its health.
The Toolkit Components
Here is the stack I have seen work effectively to mimic an incident response system without high engineering overhead.
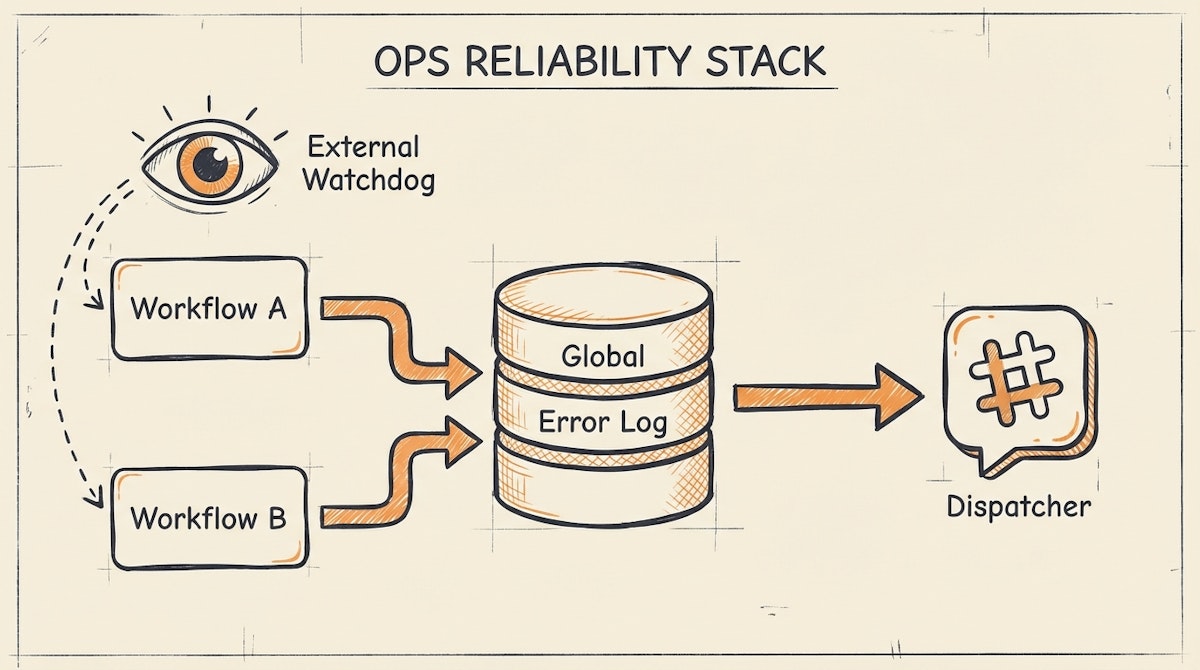
1. The Central Logger (The "Black Box" Recorder)
Recommended Tools: Airtable, Baserow, or Postgres (via Supabase)
Instead of letting error data evaporate, every automation should dump failures into a centralized database. This serves as your "Source of Truth" for system health.
- How it works: In your automation tool (e.g., Make), the error handler route shouldn't just send an email. It should create a record in a "Global Error Log" table.
- Key Fields: Timestamp, Workflow Name, Error Message, Raw Input Data (JSON), and Status (New, Investigating, Resolved).
- Why this matters: It allows you to spot patterns. If you see 10 errors from the "Invoice Processing" workflow in one hour, you know it is systemic, not a fluke.
2. The Urgent Dispatcher (The "Pager")
Recommended Tools: Slack (Webhooks), Microsoft Teams, or Twilio
Logs are for analysis; alerts are for action. The goal here is to reduce the "Time to Awareness."
- How it works: When a high-priority record hits the Central Logger (above), an automation immediately fires a message to a dedicated channel (e.g.,
#ops-alerts). - The Structure: The message should contain the direct link to the specific workflow execution history and the raw data ID.
- The Upgrade: For truly critical failures (like payroll), I have seen teams use Twilio to send an SMS to the on-call Ops Manager if the error occurs outside business hours.
3. The External Pulse (The "Heartbeat")
Recommended Tools: UptimeRobot or Better Uptime
Sometimes the automation tool itself goes down, or your webhook listener stops responding. Internal error handlers won't catch this because the workflow never starts.
- How it works: Set up a "Heartbeat" scenario. Create a simple workflow that runs every 5 minutes and returns a 200 OK response to a webhook. Point UptimeRobot at that webhook. If the webhook fails to respond, UptimeRobot alerts you.
- Why this matters: It detects total platform outages which internal logic cannot catch.
Comparison: Ad-Hoc vs. Managed Response
The shift from reactive to proactive governance changes how the organization perceives your department.
| Feature | Ad-Hoc Setup | Reliability Toolkit |
|---|---|---|
| Detection Time | Hours (User Report) | Seconds (System Alert) |
| Error Context | Scattered Emails | Centralized Database |
| Stakeholder Trust | Low (Uncertainty) | High (Transparency) |
The "Status Page" Strategy
One concept I strongly advocate for is the internal Status Page. When engineering services like GitHub go down, they post on a public status page. Ops teams should do the same.
You can use a simple Notion page or a dedicated tool like Atlassian Statuspage (they have a free tier). When the "Urgent Dispatcher" catches a critical error in the ERP sync, you update the status page to "Degraded Performance."
This preempts the "Is the system down?" tickets. It shows HR and Finance that you are already aware of the issue and working on it. It turns a technical failure into a communication win.
Conclusion
Reliability in internal operations is not about preventing every single error—API limits and bad data make that impossible. It is about how fast you detect and recover from those errors.
By assembling a toolkit that logs, alerts, and communicates status, you move away from being the person who fixes things when yelled at, to the person who manages a professional, resilient system. That is how you secure budget and buy-in for future scalability.