Teardown: Hightouch’s Reverse ETL & The Contextual Data Push Process
The hardest part of a Data Analyst's job isn't usually writing the SQL query or cleaning the dataset. It is getting the stakeholder to actually look at the dashboard.
We build elaborate reporting suites, meticulously modeled in dbt and visualized in Tableau, Looker, or PowerBI, only to find that the sales team or support agents haven't logged in for weeks. The data is accurate, but the adoption is low because the "friction cost" of switching context—leaving a CRM or Slack to open a dashboard—is too high for most operational teams.
I have observed that the most effective data teams are solving this user adoption problem by borrowing a concept from engineering: Reverse ETL.
Popularized by companies like Hightouch and Census, Reverse ETL flips the traditional model. Instead of pulling data out of operations to sit in a warehouse, it pushes analyzed data back into the operational tools where people work. For a data analyst, this is the shift from providing passive insights to triggering active behaviors.
Below is a deep dive into the Contextual Data Push Process, a low-code approach to implementing Reverse ETL principles using tools like n8n or Make. This approach bridges the gap between technical data integrity and human behavior.
The Problem: Dashboard Fatigue and Context Switching
Data Analysts often rely on a "Pull" model: users must actively seek out information. This relies on the user remembering to check the data, navigating to the right URL, and filtering for their specific context.
From a behavioral science perspective, every click adds friction. When data lives outside the workflow, it often gets ignored until a fire drill forces someone to look at it.
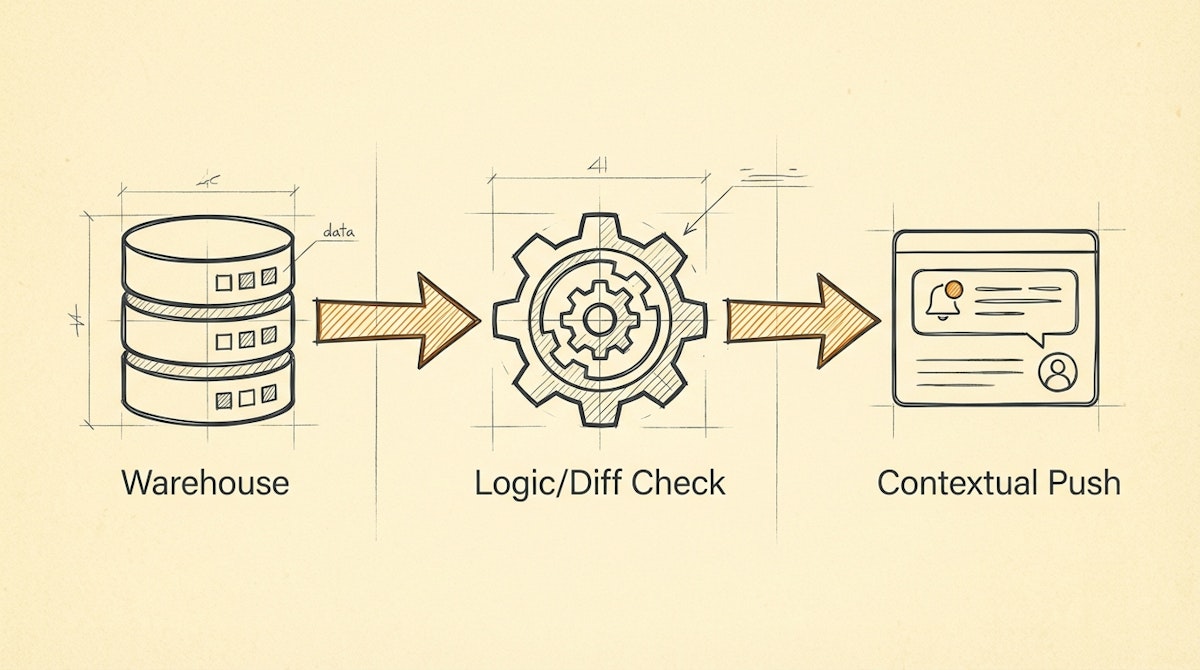
The Solution: The Contextual Data Push Process
To increase adoption, we can architect a pipeline that delivers the "Last Mile" of analytics directly to the user. This process detects significant changes in the trusted data layer (the warehouse or master base) and injects that insight into the user's interface (Slack, Microsoft Teams, Salesforce, HubSpot).
Here is how to structure this architecture using low-code orchestration.
Phase 1: The Delta Detector (SQL/Logic Layer)
The first step is identifying what is worth pushing. We do not want to replicate the dashboard in a Slack channel (that creates noise). We want to push actionable changes.
In a tool like n8n, this usually starts with a scheduled SQL execution against the data warehouse (BigQuery/Postgres/Snowflake).
The Logic Pattern:
- Select Target Cohort: Query rows that meet a specific condition (e.g.,
churn_probability > 80%ORusage_drop > 20%). - Diff Check: Compare the current state against the state from the previous run. This prevents spamming the user with the same alert every hour. This requires a small persistent state (a simple Redis key or a dedicated tracking table) to store the
last_notified_value.
Phase 2: The Context Assembler
Raw data is rarely persuasive. To drive user adoption, the push must tell a story. This is where the Analyst transitions into an Engineer.
Instead of sending "Client X Usage: 20%," the automation must assemble context.
- Lookup: Query the CRM to find the Account Owner's Slack ID or Email.
- Enrichment: Pull the last three support ticket subjects for that client.
- Formatting: Construct a payload that groups these disparate data points into a single, readable block.
Phase 3: The Interactive Delivery
The goal is to remove friction. If we send an email, the user still has to switch tabs to fix the issue. The modern approach utilizes Interactive Block Kits (available in Slack and Teams).
The automation sends a card containing:
- The Insight: "Client X usage dropped 20%."
- The Context: "They also have an open high-priority ticket."
- The Action: A button labeled "Open in Salesforce" or "Mark as Reviewed."
Comparing Delivery Methods
When designing this process, the delivery vector matters as much as the data itself.
| Feature | Passive Dashboard | Contextual Push |
|---|---|---|
| User Friction | High (Must Login) | Low (In-Flow) |
| Data Latency | Real-time (Pull) | Event-Driven (Push) |
| Actionability | Analytical | Operational |
| Adoption Risk | Ignored over time | Alert Fatigue |
Managing The Risk: Alert Fatigue
The primary risk of the Contextual Data Push Process is swinging the pendulum too far. If the Data Analyst configures the logic to trigger on every minor data change, the users will mute the channel.
To mitigate this, implement Throttling Logic inside the automation:
- Frequency Cap: Ensure a specific account/topic is not flagged more than once every X days.
- Priority Threshold: Only push data when the deviation exceeds a standard deviation (Z-score > 2).
Conclusion
For the Data Analyst, success is not defined by the complexity of the query, but by the impact of the insight.
By moving from a passive dashboard model to an active Contextual Data Push Process, analysts can ensure their work actually drives business decisions. It aligns the technical reliability of the data warehouse with the human reality of daily workflows, turning data governance into a tool for empowerment rather than just reporting.
References
What is Reverse ETL? (Hightouch)
The Era of Operational Analytics (Census)
Related posts
Guaranteing Dashboard Trust With The Data Heartbeat Process
Stabilizing Data Pipelines With The Metadata Sidecar Process
Reviewing Customer.io: The Event-Driven Logic Engine For Behavioral Targeting