Assembling The Automated Experimentation Toolkit To Scale CRO (Ref: Optimizely)
The Velocity Bottleneck
If you work in growth, you know the formula: Growth = Number of Experiments × Success Rate.
Most teams obsess over the success rate—trying to craft the "perfect" copy or the "perfect" landing page design before launching. But in my experience, the biggest lever is actually the number of experiments you can run per week.
The bottleneck is rarely a lack of ideas. The bottleneck is the operational friction of setting up the test. You have to draft the copy, get design approval, build the landing page variant, set up the tracking, and then manually check the analytics dashboard three days later to see if it reached statistical significance.
This administrative overhead caps most teams at 1 or 2 experiments a week. I’ve observed that by treating experimentation as an automated data pipeline rather than a series of creative projects, you can increase that velocity by an order of magnitude.
This article outlines a toolkit I call The Automated Experimentation Stack. The goal isn’t to replace the strategist, but to remove the manual labor of assembly and analysis, effectively creating a "lite" version of platforms like Optimizely using composable tools.
The Core Philosophy: Decoupling Strategy from Execution
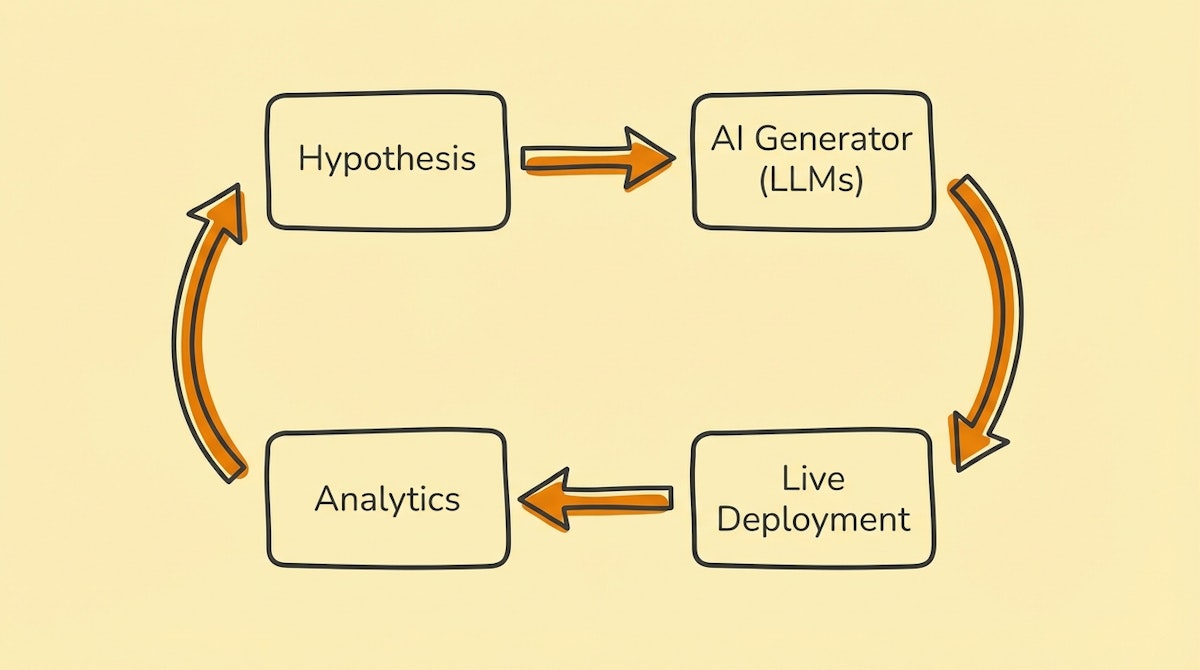
The fundamental shift here is moving from a linear workflow (Idea -> Build -> Launch) to a generative workflow (Hypothesis -> System -> Variants).
Instead of hardcoding one landing page, you define the parameters of the page (headline, hero image, CTA) and let the system generate and deploy the permutations.
The Toolkit Components
Here is the stack I see working best for Growth Engineers who want to own their infrastructure:
1. The Experiment Repository: Airtable
Spreadsheets are too brittle for this. You need a relational database to track the hierarchy of Campaign -> Experiment -> Variant -> Result.
- Role: The "State Machine."
- Why: You need structured fields for your hypothesis, your target metrics, and your variant parameters. Airtable’s API allows the Orchestrator to read these parameters and write back performance data.
- Key Feature: Use the "Interfaces" feature to create a dashboard where non-technical marketers can input a hypothesis without touching the backend logic.
2. The Creative Engine: OpenAI (GPT-4o) & Anthropic (Claude 3.5 Sonnet)
I recommend using a "Adversarial Generation" pattern here.
- Role: The Copywriter and Designer.
- Why: Don't just ask one model to write copy. I’ve found success by having GPT-4o generate the variant copy based on a specific framework (like Cialdini’s principles of persuasion), and then using Claude 3.5 Sonnet to "critique" and refine it before it goes live.
- Application: Generating headline variants, reshaping value propositions, and even formatting JSON for dynamic landing page components.
3. The Orchestrator: Make (formerly Integromat)
This is the nervous system that connects your repository to your deployment tools.
- Role: The Traffic Controller.
- Why: It handles the logic: "When a new record is created in Airtable with status 'Ready', generate 5 variants, push them to the CMS, and listen for the results webhook."
- Critical Step: Use Make’s error handlers to ensure that if the AI generates malformed HTML or JSON, the automation flags it for human review rather than breaking the live site.
4. The Deployment Layer: Webflow or Unbounce (via API)
To move fast, you cannot rely on engineering deployments.
- Role: The Presentation Layer.
- Why: Both platforms have robust CMS APIs. You can programmatically create new landing pages by injecting the variables generated by your AI models into pre-built templates.
- Constraint: Stick to fixed templates where only the content (text/images) changes dynamically. Changing layout structure programmatically introduces too much visual risk.
5. The Judge: Mixpanel or PostHog
GA4 is often too slow or sampled for rapid iteration.
- Role: The feedback loop.
- Why: You need event-based analytics that can trigger webhooks. When a variant hits 1,000 views, the system should automatically calculate the conversion rate and update the Airtable record.
Comparison: Manual Ops vs. The Automated Toolkit
| Metric | Manual Ops | Automated Toolkit |
|---|---|---|
| Setup Time | Hours per variant | Minutes per batch |
| Testing Volume | Low (1-2/week) | High (10-20/week) |
| Bias Risk | High (Emotional attachment) | Low (Statistical selection) |
The Implementation Process
- Define the Schema: In Airtable, create a table for "Assets" (Headlines, Images) and a table for "Combinations."
- Build the Generator: Set up a Make scenario that watches for a new Hypothesis. It should trigger an LLM to generate 5 headlines and 3 sub-headlines based on that hypothesis.
- Inject Parameters: Map these text outputs to your Webflow CMS fields via API.
- Close the Loop: Create a scheduled automation that runs every morning, queries the Mixpanel API for the previous day’s conversion data, and updates the Airtable record. If a variant underperforms by >20%, the automation can automatically archive it.
Conclusion
The value of this toolkit isn't just that it saves time—it fundamentally changes your relationship with failure. When launching an experiment costs four hours of work, a failed test feels like a waste. When it costs five minutes of API processing time, a failed test is just a data point.
By assembling this stack, you shift from being a builder of pages to an architect of experiments. That is how you scale CRO without scaling headcount.