Assembling the Low-Code ETL Toolkit for Independent Data Standardization
The Shift from Data Janitor to Data Architect
For many of us working with data, the reality is often less about "generating insights" and more about fighting fires. We spend the majority of our time manually exporting CSVs, fixing date formats that mysteriously changed over the weekend, or waiting on engineering teams to prioritize a simple API connector so we can finally automate a weekly report.
The pain point isn't usually the analysis itself; it is the Data Janitorial Work—the extraction, cleaning, and standardization required before the real work can even begin. When you rely on fragile spreadsheets or overburdened engineering teams for these pipelines, you lose speed and autonomy.
To solve this, I rely on a specific stack I call The Agile ETL Toolkit. This isn't about replacing enterprise data warehouses, but about empowering analysts to build their own robust, self-healing ingestion pipelines without writing Python scripts or managing servers. This approach leverages Make for orchestration and Airtable for logic and staging.
The Core Components of the Agile ETL Toolkit
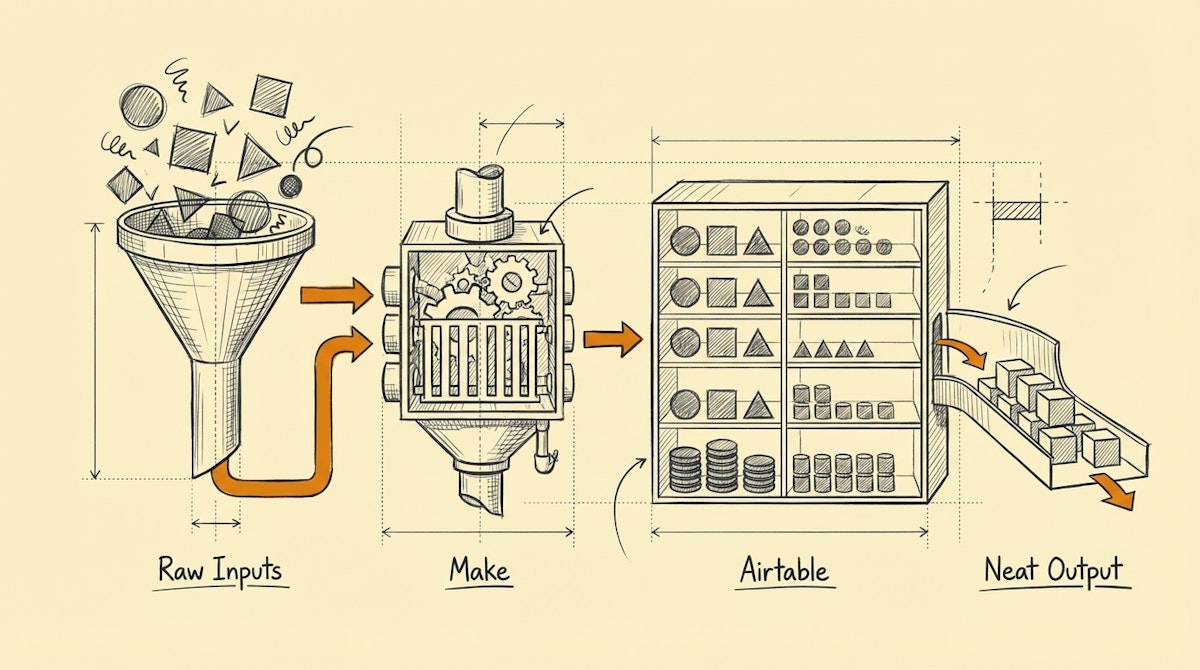
This toolkit focuses on three functional areas: Ingestion (The Carrier), Transformation (The Cleaner), and Storage/Load (The Warehouse).
1. The Orchestration Layer: Make
Most data analysts are comfortable with SQL, but dealing with OAuth handshakes, webhooks, and pagination logic in scripts can be a heavy lift to maintain. Make acts as the "Carrier" in this toolkit.
- Why it fits the Analyst Persona: Unlike linear automation tools, Make allows for complex logic, error handlers, and array iterations which mimic standard programming concepts. It visualizes the data flow, making debugging API responses significantly faster.
- The Specific Role: Use Make to fetch raw JSON from SaaS APIs (CRM, Ad Platforms, Payment Gateways). Crucially, do not try to do heavy data transformation here. Use it strictly to extract data and handle transport errors (like 429 Rate Limits).
2. The Staging & Logic Layer: Airtable
This is the most critical piece of the toolkit. We use Airtable not just as a database, but as a visual transformation engine.
- Why it fits the Analyst Persona: It enforces data types. If you try to push a string into a date field, it fails (or can be set to flag the error). This acts as a quality gate.
- The Specific Role: This is where the "T" in ETL happens.
- Deduplication: Use simple scripting extensions or unique field constraints to prevent duplicate entries.
- Standardization: Use formulas to normalize text (e.g., converting "USA", "U.S.", and "United States" to "US").
- Enrichment: This is where you can easily plug in an LLM via Make to classify unstructured text before it hits your BI tool.
3. The Connectivity Layer: Softr or Whalesync
Once data is clean in Airtable, it often needs to go somewhere else to be visualized or stored permanently.
- Why it fits the Analyst Persona: These tools handle the two-way sync or the publishing of data without manual exports.
- The Specific Role: Whalesync acts as a real-time mirror between your staging environment (Airtable) and your destination (like Postgres or Webflow), ensuring that your dashboard always reflects the cleaned state of the data without manual refreshes.
The Process: The Staged Ingestion Pattern
Using this toolkit, we build a process that separates concerns to ensure reliability.
- Raw Ingestion: Make polls the source API every hour. It does not filter or clean; it simply grabs the payload and dumps it into a "Raw Data" table in Airtable.
- Sanitization: Airtable Automations trigger immediately upon record creation. Scripts run regex checks on email formats, standardize currency codes, and flag anomalies.
- Loading: Once a record is marked "Clean" by the system logic, a secondary Make scenario (or Whalesync connection) pushes it to the final destination (Data Warehouse or Dashboard).
Why This Matters
The hidden benefit of this toolkit isn't just saving time—it is Data Trust. When you build a system that automatically flags anomalies (e.g., "Revenue field contains text") rather than silently failing or corrupting a report, you build trust with the stakeholders reading that report. You move from being the person who fixes the spreadsheet to the architect who ensures the numbers are right, every single time.